PEA Summary
Key Highlights:
- After-tax NPV (5%) of US$104.1 M, IRR of 94.8% and a payback period of 0.9-years at base case average silver price of US$44.58/ounce (“oz”).
- After-tax NPV (5%) of US$312.2 M, IRR of 186.9% and a payback period of 0.5-years at the upside case of US$75.00/oz.
- Average annual production of ~2.5 million oz silver equivalent (“AgEq”)1 (2028-2033) with ~90% revenue from silver.
- Life-of-mine AISC of US$26.75 per payable oz AgEq.
- Initial capital of only US$19.2M, delivering 5.4x after-tax NPV/to initial capital at base case metal prices.
- Restart of processing targeted for late 2026 with full ramp-up by mid-2027
- Early restart work is underway at the mine and mill and discussions are underway to select an underground contractor.
- Silver equivalent (“AgEq”) is calculated by converting byproduct metal production (gold, lead, and zinc) into silver ounces based on the relative value of their price assumptions compared to the silver price assumption utilized in the economics.
PEA Overview
The PEA was prepared by JDS Energy & Mining Inc. ("JDS"), Forte Dynamics (“Forte”), and SGS Geological Services (“SGS”).
The PEA outlines a low-capital restart of an existing underground mine with an initial approximately nine-year mine life and steady-state throughput of 1,200 tonnes per day (“tpd”). Production is scheduled to begin in late 2026, with full ramp-up by the end of H1 2027, and average annual output of 2.47 million oz AgEq produced from 2028-2033.
PEA Summary Table
| Units | ||
|---|---|---|
| Mill Feed | ||
| Mine Life | years | 8.3 |
| Mine Throughput | Mt/annum | 4.4 |
| Milling Throughput | t/d | 1,200 |
| Silver Recovery | % | 84.0% |
| Lead Recovery | % | 91.5 |
| Zinc Recovery | % | 73.0 |
| Gold Recovery | % | 79.0 |
| Average AgEq Produced(1) | M AgEqoz/year | 2.1 (peak 2.8) |
| Average AgEq Payable(1) | M AgEqoz/year | 1.7 (peak 2.4) |
| Financial Analysis - Base Case (Average Ag - $44.58/oz)(2) | ||
| Pre-Tax NPV5% | $M | 188.2 |
| Pre-Tax IRR | % | 155.7 |
| Pre-Tax Payback | years | 0.6 |
| After-Tax NPV5% | $M | 104.1 |
| After-Tax IRR | % | 94.8% |
| After-Tax Payback | years | 0.9 |
| Financial Analysis - Upside Case (Fixed Ag - $75/oz)(2) | ||
| After-Tax NPV5% | $M | 312.2 |
| After-Tax IRR | % | 186.9 |
| After-Tax Payback | years | 0.5 |
| Capital Costs | ||
| Initial(3) | $M | 19.2 |
| Sustaining, including closure | $M | 140.6 |
| Operating Costs | ||
| Mining | $/t | 40.27 |
| Processing | $/t | 23.23 |
| G&A | $/t | 9.03 |
| Contingency | $/t | 3.63 |
| Cash Operating Costs | $/AgEqoz | 17.24 |
| Site AISC | $/AgEqoz | 26.75 |
Notes:
- Average Produced and Payable excludes values from 2026
- Metal prices for Lead, Zinc, and Gold for both Base and Upside cases are $0.91/lb, $1.21/lb, and $3,000/oz respectively.
- Initial capital is inclusive of all capital spend and owners costs to end of Q1 2027 and includes revenue generation during commissioning period from Q4 2026 to Q1 2027
Mining and Processing
Mining activities will focus on three primary zones: Promontorio, San Miguel, and Eduwiges. Initial production will prioritize the Promontorio zone to leverage extensive existing underground infrastructure and advanced mine development. Development of the newly defined San Miguel zone is slated to proceed concurrently, with a target to be fully ramped up by the end of H1 2027. The extraction will utilize conventional sublevel long-hole open stoping in a retreat strategy, performed by specialized contract miners. To optimize grade delivery, the Company will employ a stockpiling strategy for lower-grade material.
Ore will be transported from the mine via 30-tonne highway trucks to the Company’s existing 1,200 tpd processing facility, located approximately 40 km from the mining areas. The mill utilizes a conventional comminution and flotation circuit designed to produce a high-value bulk lead-silver concentrate. The project currently maintains constructed tailings storage capacity for the first 12 months of production. Permitting is already in place for additional capacity required by the end of 2027.
Production Schedule
| Units | Y-1 | Y1 | Y2 | Y3 | Y4 | Y5 | Y6 | Y7 | Y8-9 | LOM | |
|---|---|---|---|---|---|---|---|---|---|---|---|
| Mill Feed | |||||||||||
| Milled (kt) | Kt | 40 | 370 | 432 | 432 | 432 | 432 | 432 | 432 | 554 | 3,556 |
| Ag Feed Grade | g/t | 175.3 | 162.6 | 186.7 | 160.3 | 193.5 | 125.6 | 132.7 | 158.8 | 101.3 | 151.0 |
| Au Feed Grade | g/t | 0.06 | 0.17 | 0.21 | 0.22 | 0.13 | 0.15 | 0.10 | 0.13 | 0.10 | 0.15 |
| Pb Feed Grade | % | 0.25 | 0.50 | 0.73 | 078 | 0.92 | 1.57 | 1.15 | 0.83 | 0.43 | 0.85 |
| Zn Feed Grade | % | 0.28 | 0.46 | 0.75 | 1.88 | 1.21 | 1.92 | 1.85 | 1.18 | 0.68 | 1.10 |
| Metal Recovered to Concentrate | |||||||||||
| Ag | Koz | 188 | 1,624 | 2,178 | 1,871 | 2,258 | 1,465 | 1,548 | 1,853 | 1,516 | 14,502 |
| Au | Koz | 0.1 | 1.6 | 2.3 | 2.4 | 1.5 | 1.7 | 1.0 | 1.4 | 1.4 | 13.4 |
| Pb | Mlbs | 0.2 | 3.8 | 6.4 | 6.8 | 8.0 | 13.6 | 10.1 | 7.2 | 4.8 | 60.9 |
| Zn | Mlbs | 0.2 | 2.7 | 5.2 | 6.1 | 8.4 | 13.3 | 12.8 | 8.2 | 6.1 | 63.1 |
| AgEq Produced (1) | koz | 198 | 1,818 | 2,534 | 2,346 | 2,821 | 2,377 | 2,308 | 2,416 | 1,950 | 18,768 |
| Payable Metals | |||||||||||
| Ag | Koz | 179 | 1,543 | 2,069 | 1,777 | 2,145 | 1,392 | 1,471 | 1,761 | 1,441 | 13,777 |
| Au | Koz | 0.0 | 1.0 | 1.6 | 1.7 | 0.7 | 1.0 | 0.3 | 0.7 | 0.5 | 7.4 |
| Pb | Mlbs | 0.1 | 2.5 | 4.9 | 5.3 | 6.5 | 12.1 | 8.6 | 5.7 | 2.9 | 48.6 |
| Zn | Mlbs | 0.0 | 0.0 | 0.4 | 0.5 | 0.7 | 1.1 | 1.0 | 0.7 | 0.1 | 4.4 |
| AgEq Payable (2) | koz | 181 | 1,644 | 2,268 | 2,037 | 2,398 | 1,823 | 1,766 | 2,004 | 1,589 | 15,711 |
Notes:
- AgEq Produced represents the total value of all recovered metals expressed in silver ounces. This is calculated by converting byproduct metal production (gold, lead, and zinc) into silver ounces based on the relative value of their price assumptions compared to the silver price assumption.
- AgEq Payable represents the total value of all payable metals expressed in silver ounces. This is calculated by converting byproduct payable metal (gold, lead, and zinc) into silver ounces based on the relative value of their price assumptions compared to the silver price assumption.
Silver Revenue
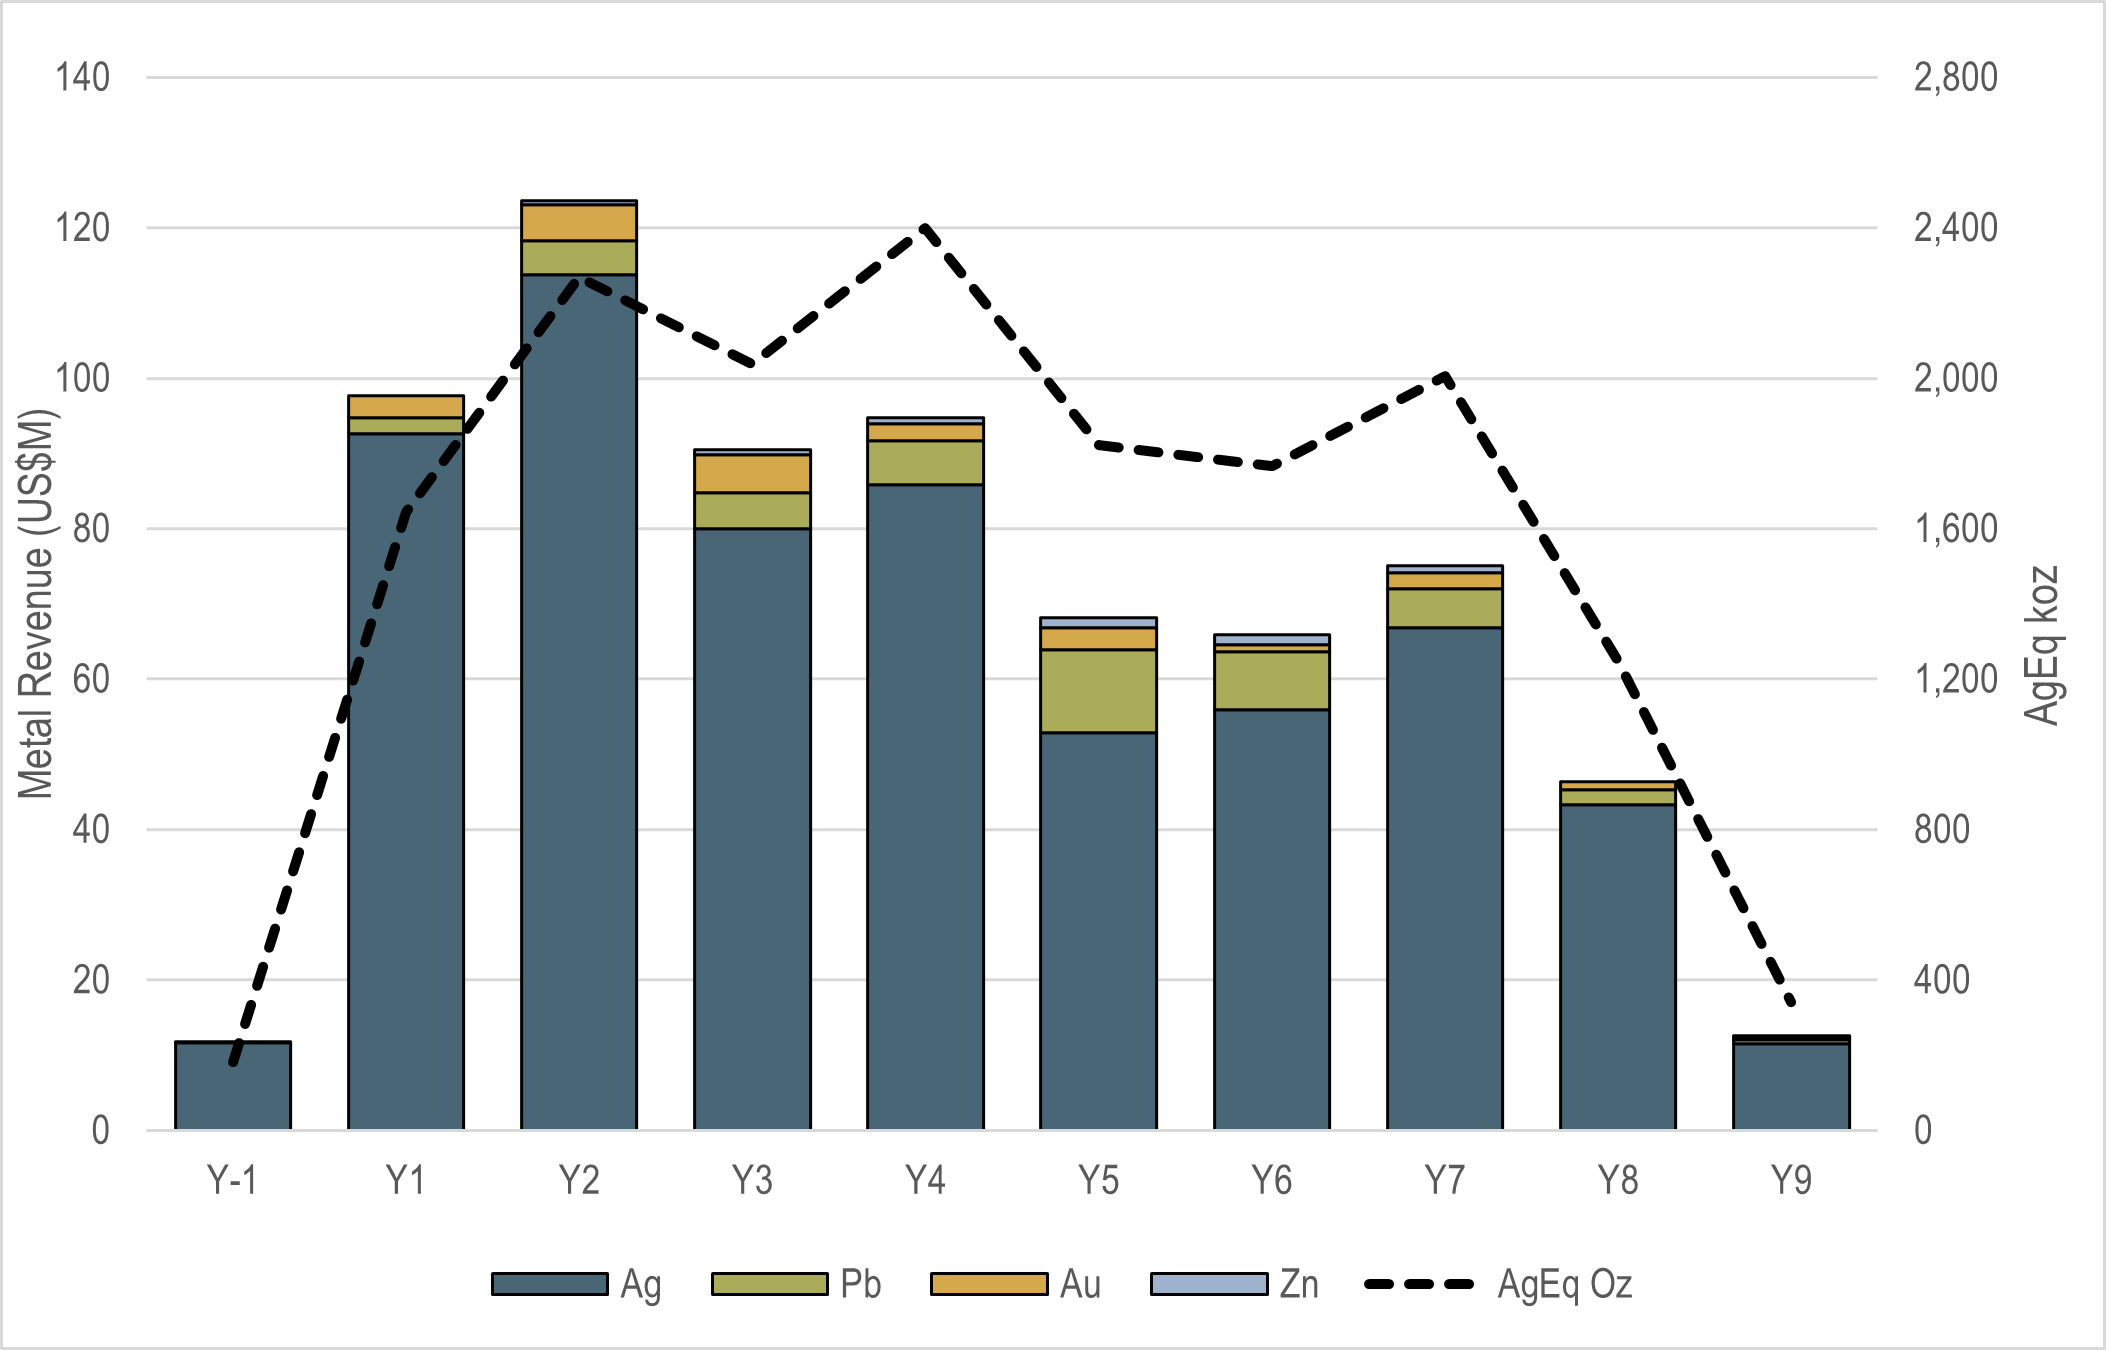
The Cusi Project’s economic profile is defined by its substantial leverage to silver prices, with 88% of the projected life-of-mine Net Smelter Return (NSR) revenue generated directly from silver production. The remaining 12% of the NSR revenue is comprised of by-product metals, including lead (8%), gold (3%), and zinc (1%), as calculated using the PEA’s metallurgical recovery, metal price assumptions, and payabilities.
Life-of-Mine Payable Revenue by Metal and Silver Equivalent Production
Metal Price Assumptions
The base case utilizes fixed metal prices for gold, lead, and zinc. Silver uses a simplified silver curve starting at $65/oz for 2026 and tapering off to a long-term price of $38/oz beginning in year 5. The average life-of-mine realized price is $44.58/oz. The silver prices in the early years of the project are based on the restart of production in late 2026, current spot prices and consensus price projections. Base case silver prices are discounted on average approximately 13% below consensus pricing of 32 banks and financial institutions.
The upside case utilizes a fixed average silver price of $75.00. Other metal prices remain unchanged from the base case assumptions.
Base Case Metal Price Assumptions
| Life of Mine | 2026 | 2027 | 2028 | 2029 | 2030+ | |
|---|---|---|---|---|---|---|
| Ag ($/oz) | $44.58 | $65 | $60 | $55 | $45 | $38 |
| Au ($/oz) | $3,000 | $3,000 | $3,000 | $3,000 | $3,000 | $3,000 |
| Pb ($/lb) | $0.91 | $0.91 | $0.91 | $0.91 | $0.91 | $0.91 |
| Zn ($/lb) | $1.29 | $1.29 | $1.29 | $1.29 | $1.29 | $1.29 |